
Ethereum has plunged over 45% from the 2024 high of $4 090 in March, including a sharp 38% drop in the past 15 days. Bitcoin also faced a substantial correction, losing 30% in just a week, exacerbated by a significant sell-off on Monday, August 5th. In this commentary, we’ll explore the primary causes of this notable market decline and its specific impact on the crypto markets.
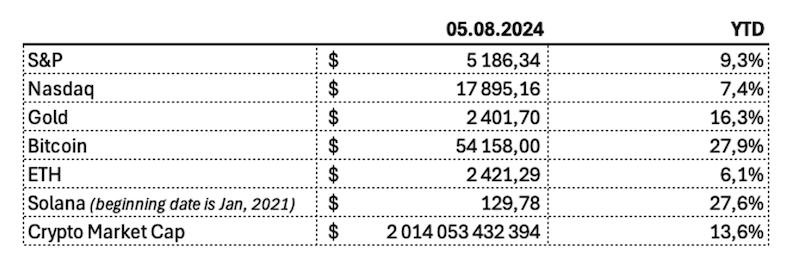
Despite the recent market volatility, US equities and all major crypto assets have achieved positive returns since the beginning of this year.
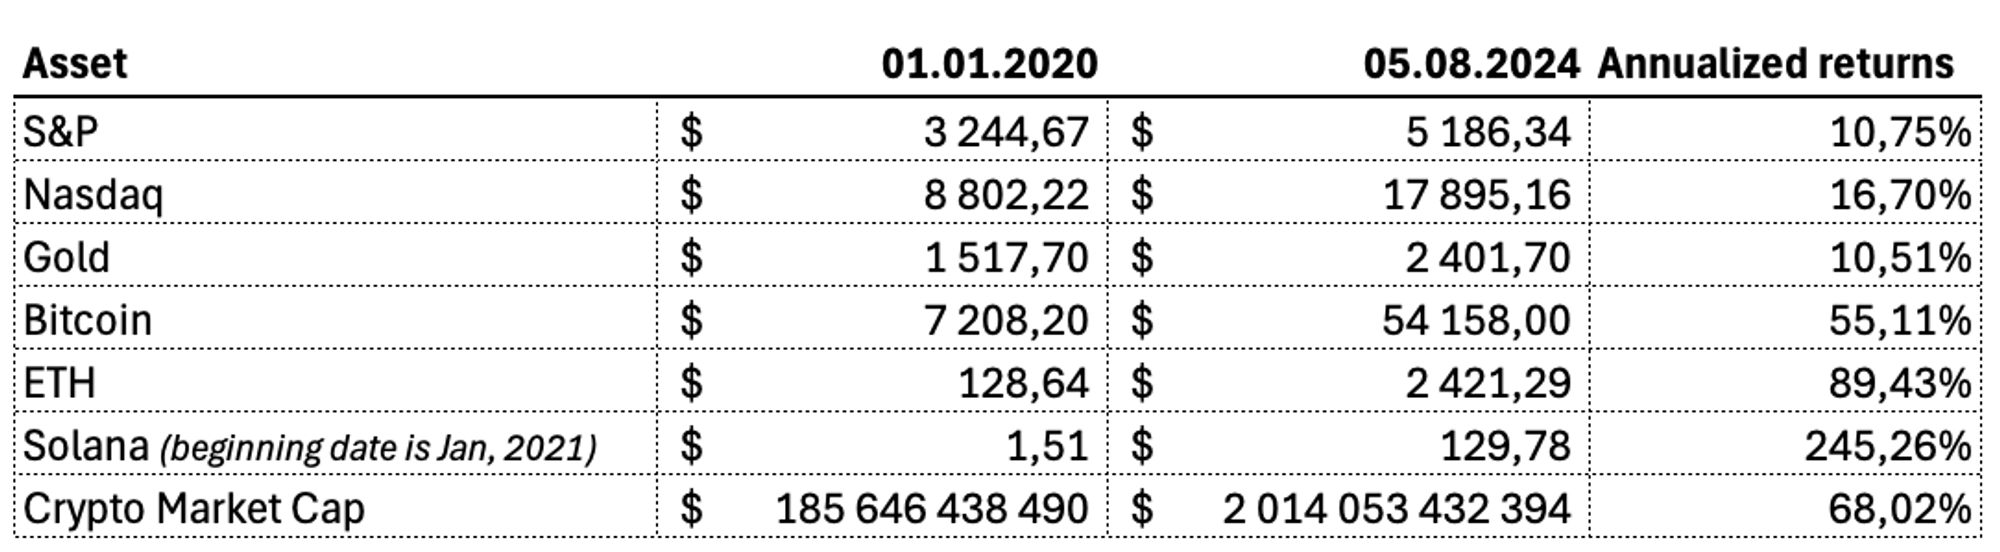
Let us put things in longer term context and expand our horizon to incorporate two previous corrections. Since January 2020, Nasdaq reached 16,7% annualized returns, Bitcoin 55,11%, and Solana 245,26%. Crypto blue chip assets significantly outperformed the US equities.
On the chart below we can see 3x major drawdowns on Nasdaq during that period:
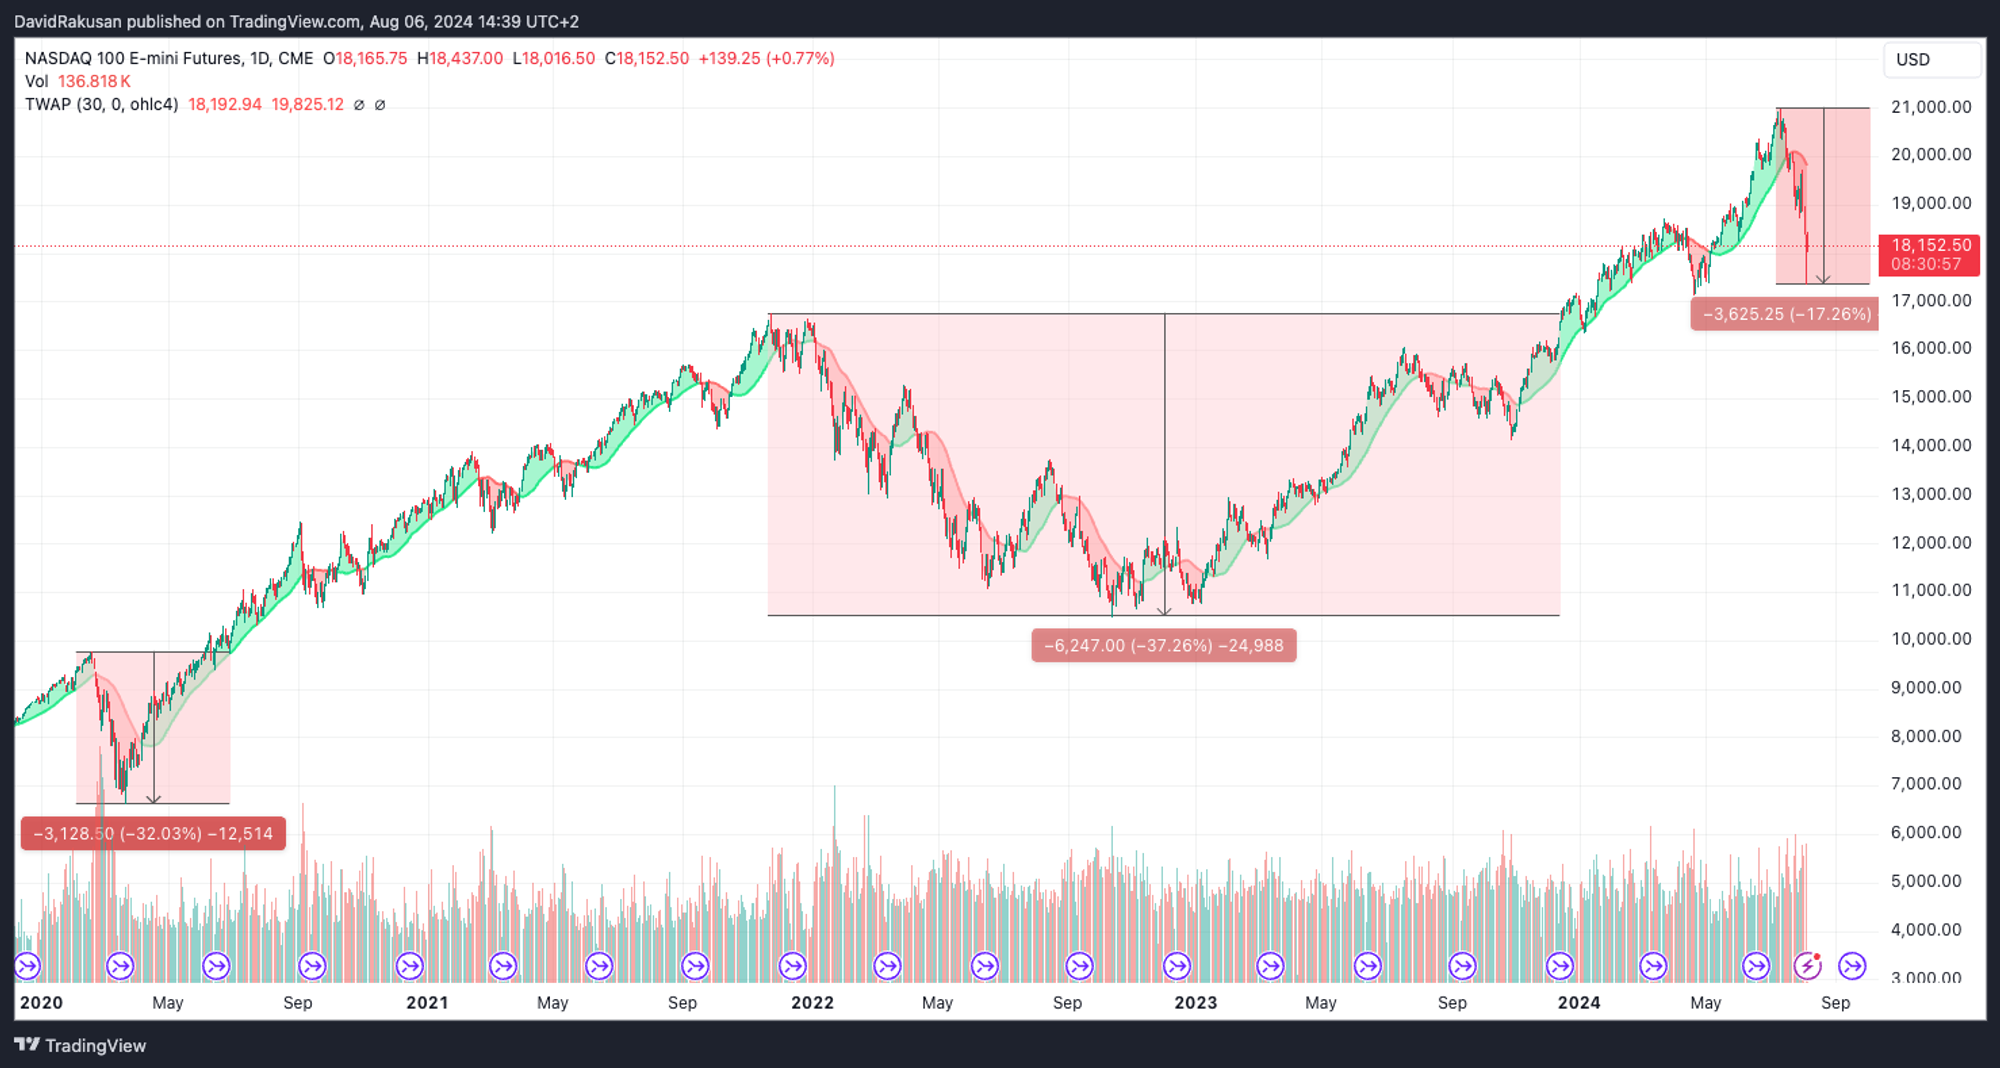
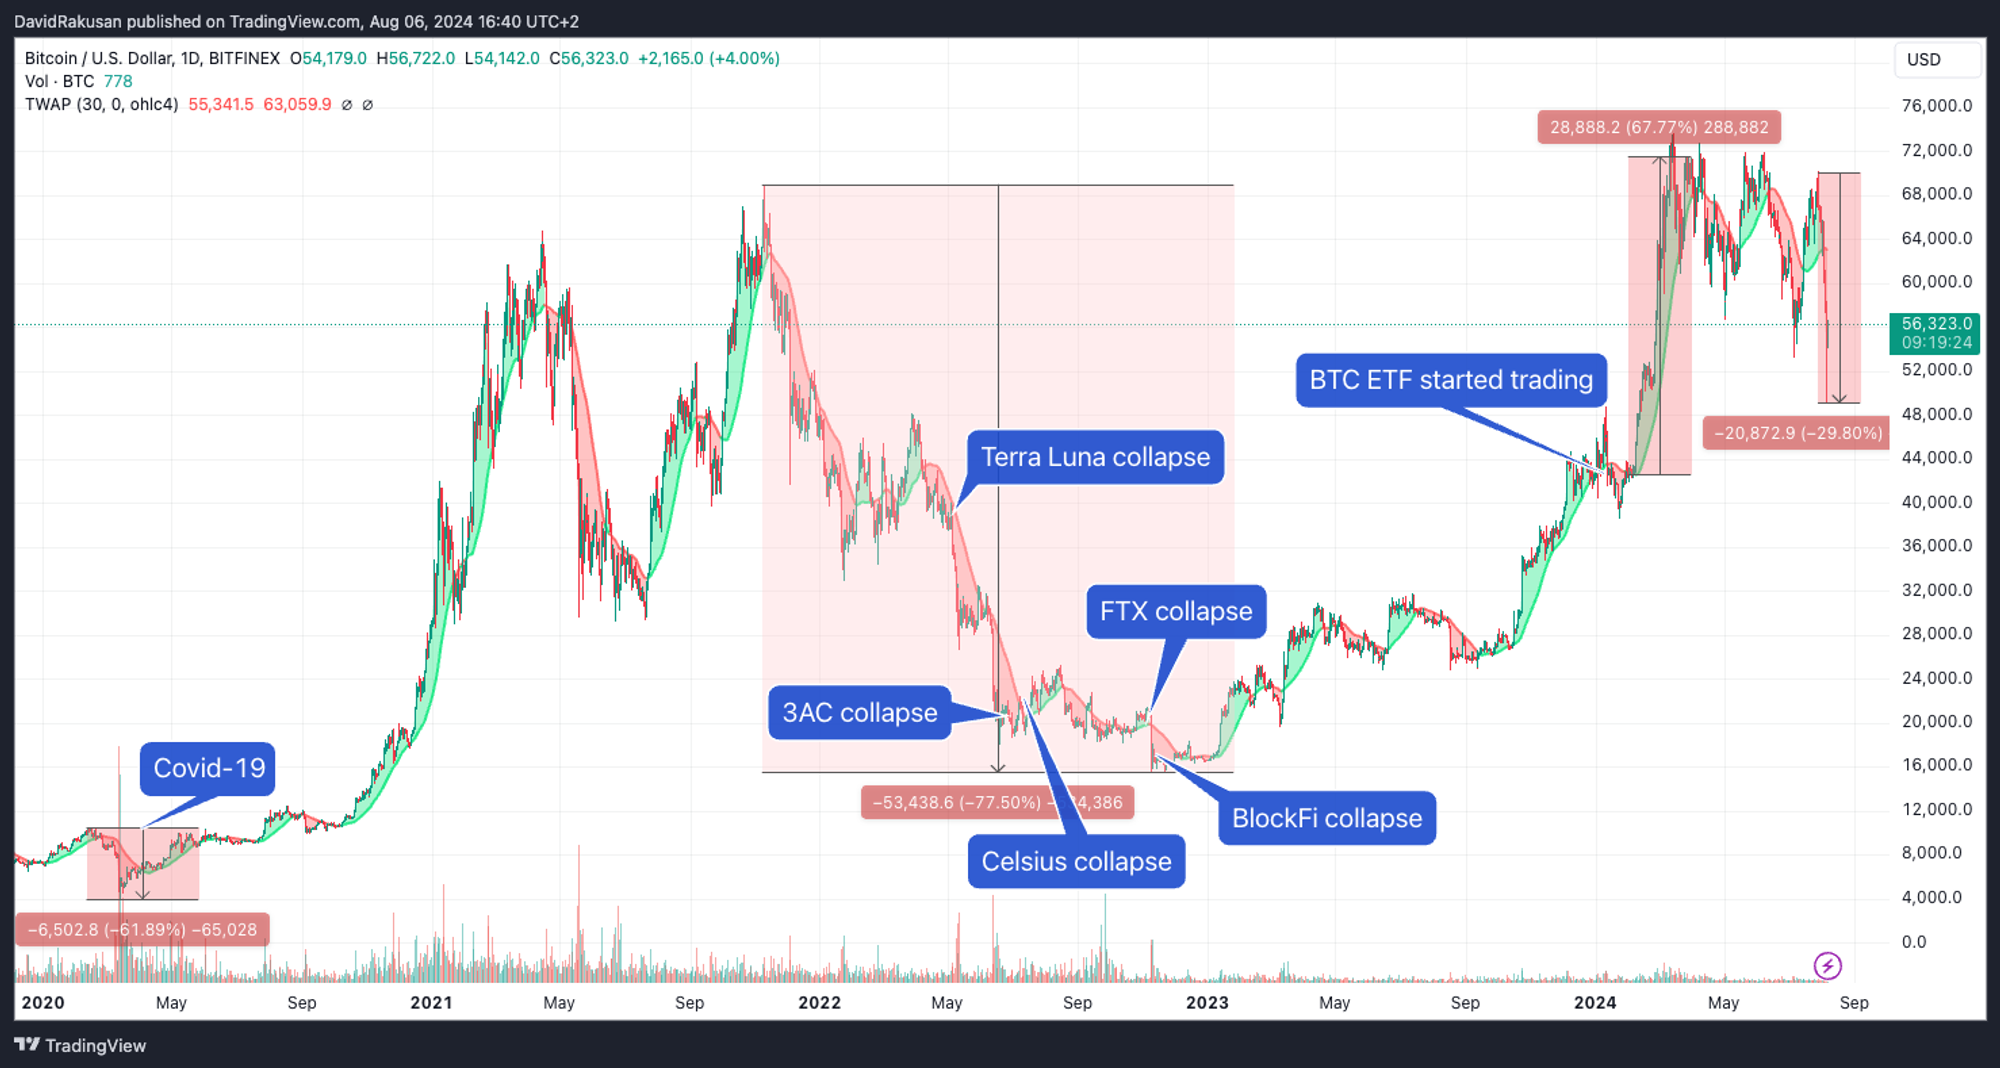
The first drawdown was caused by the fears of COVID-19 having an impact on the economy and international markets. This correction hit both tech stocks and Bitcoin, causing a 32% and 62% correction respectively.
The second, a 37% correction in tech stocks, lasted from early 2022 to late 2022. Investors were acting cautiously due to the unclear impact of continuously increasing interest rates and persistent inflation. It wasn’t clear how higher interest rates would impact the economy after more than a decade of virtually zero interest rates. There were also significant concerns about a potential recession and economic slowdown.
The crypto market faced similar concerns but was hit with several more headwinds. The collapse of Terra Luna became the spark that ignited the collapse of the crypto lending market. During 2022 we saw collapses of FTX, Three Arrows Capital, Celsius, Genesis, and BlockFi. The market recovered slowly during late 2023 and entered 2024 strong achieving significant gains in Q1 2024, fuelled by the approval of Bitcoin ETF.
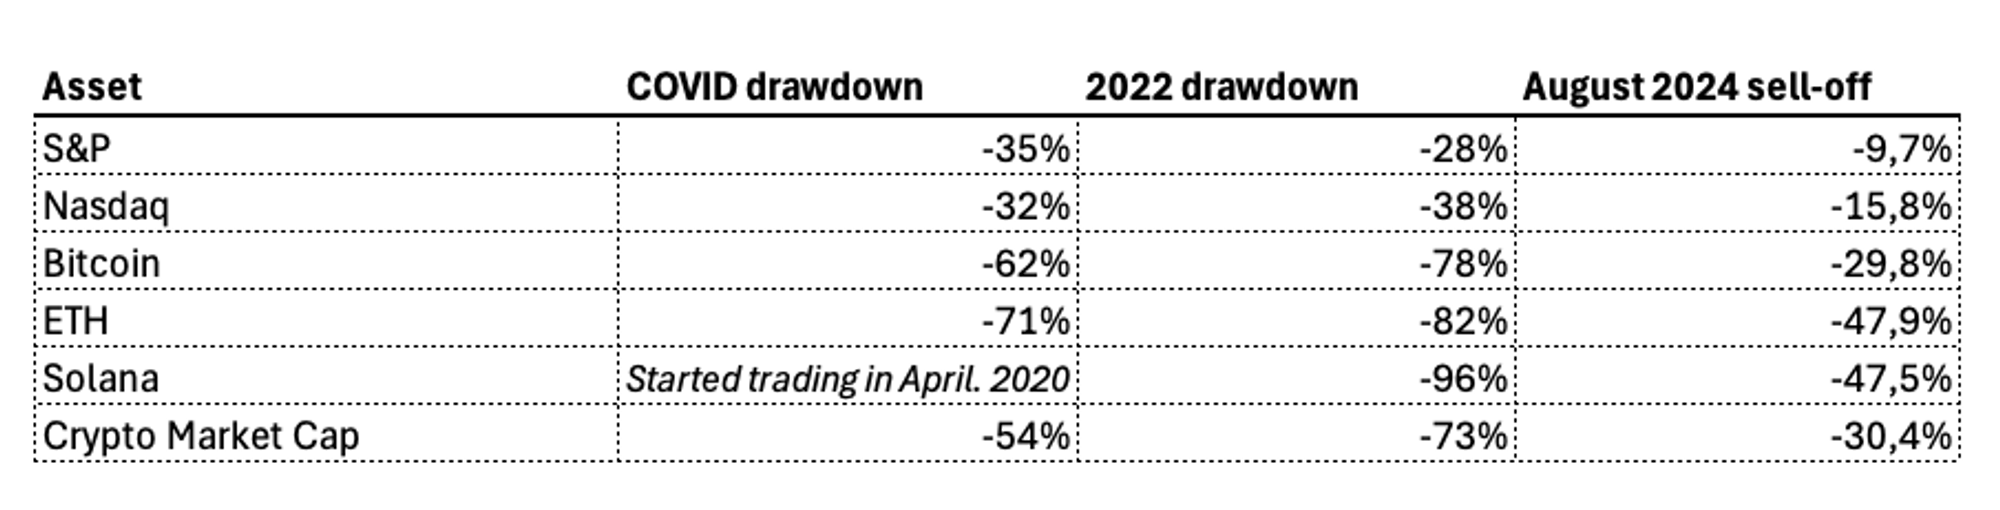
The table below summarizes the drawdowns experienced by major assets since January 2020. It puts the recent price actions into perspective with COVID and 2022 corrections. Despite the August 2024 correction not being as profound as the two previous ones, we do not know if these will be the final numbers.
In Q2 the crypto markets consolidated and traded in a range (~$55K to ~$70k). Bitcoin and other major digital assets couldn’t break the range and continue their upward momentum. Investors saw uncertainties that prevented the markets from continuing on the upward path. Let’s dissect the most influential ones.
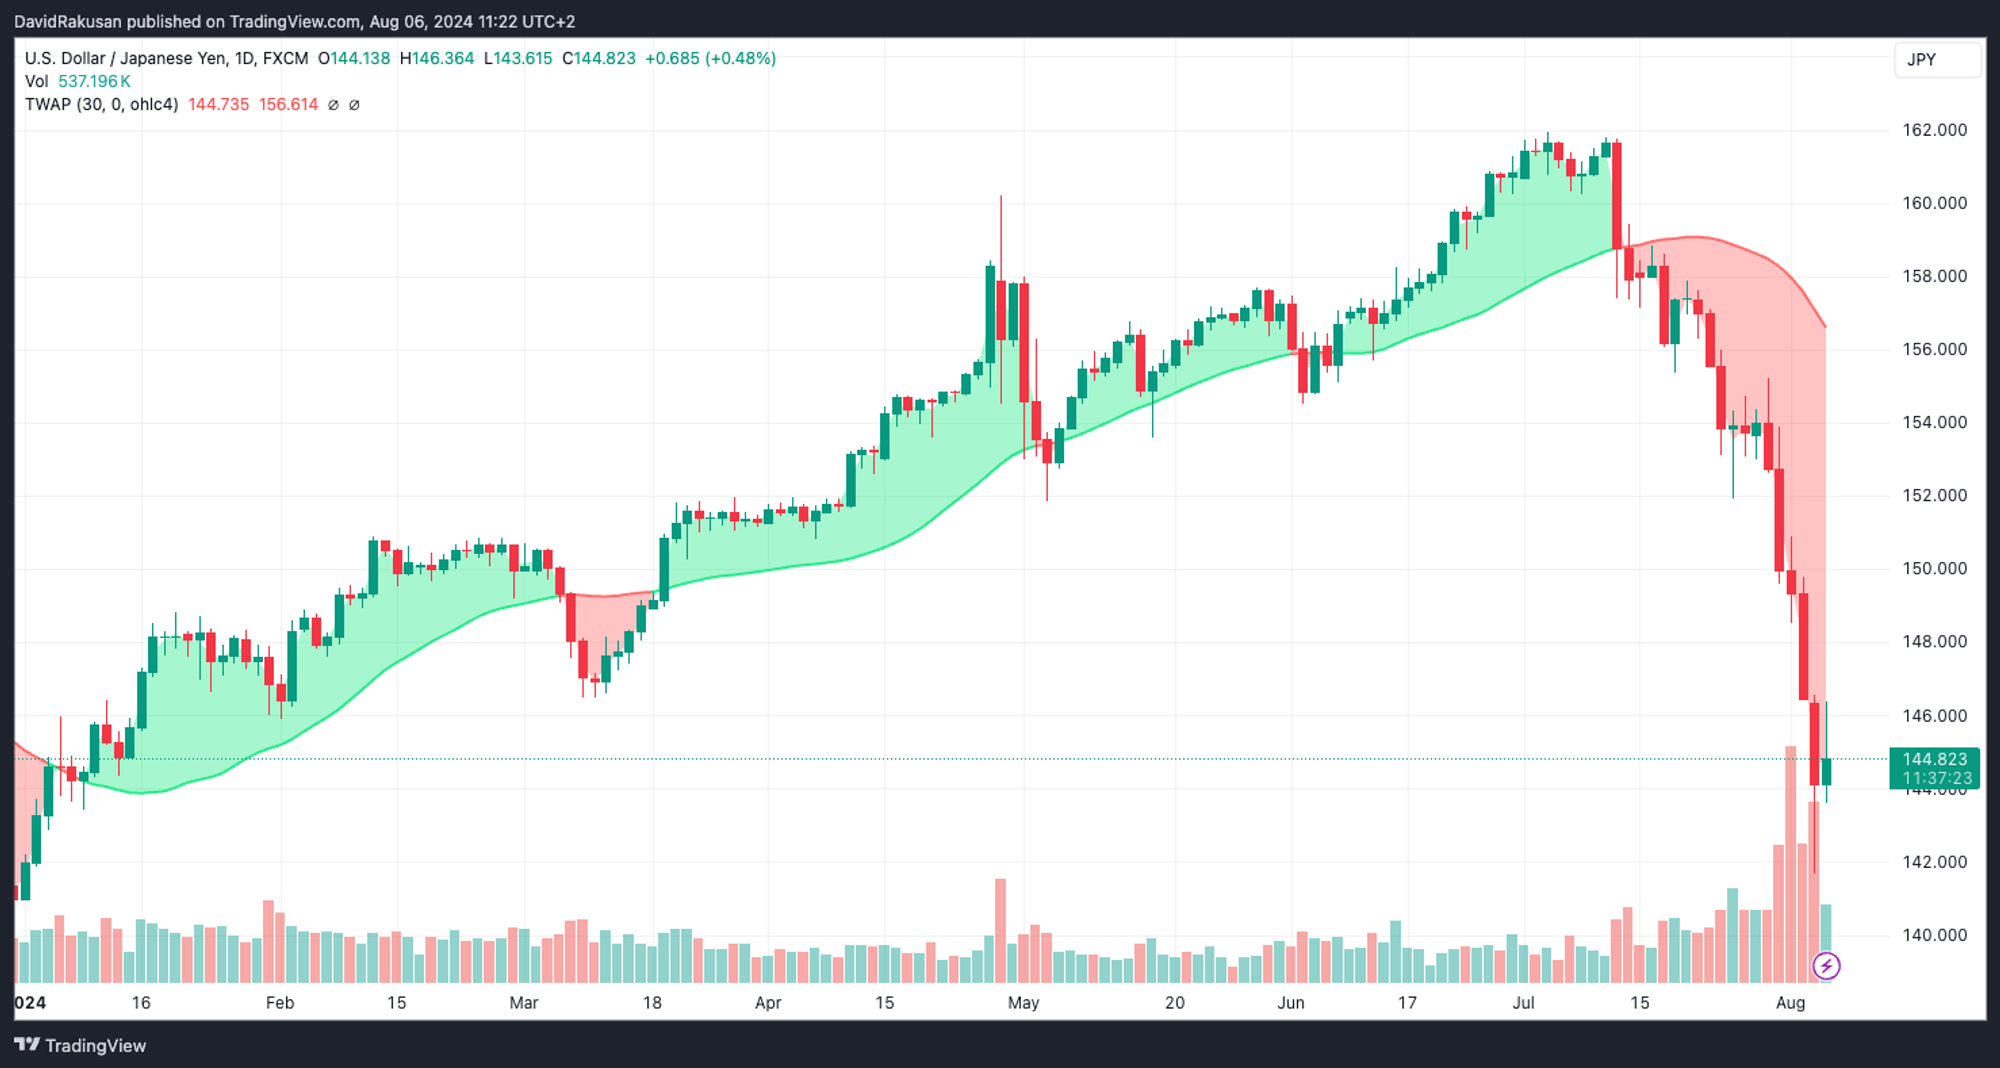
Unwinding of JPY/USD carry trade
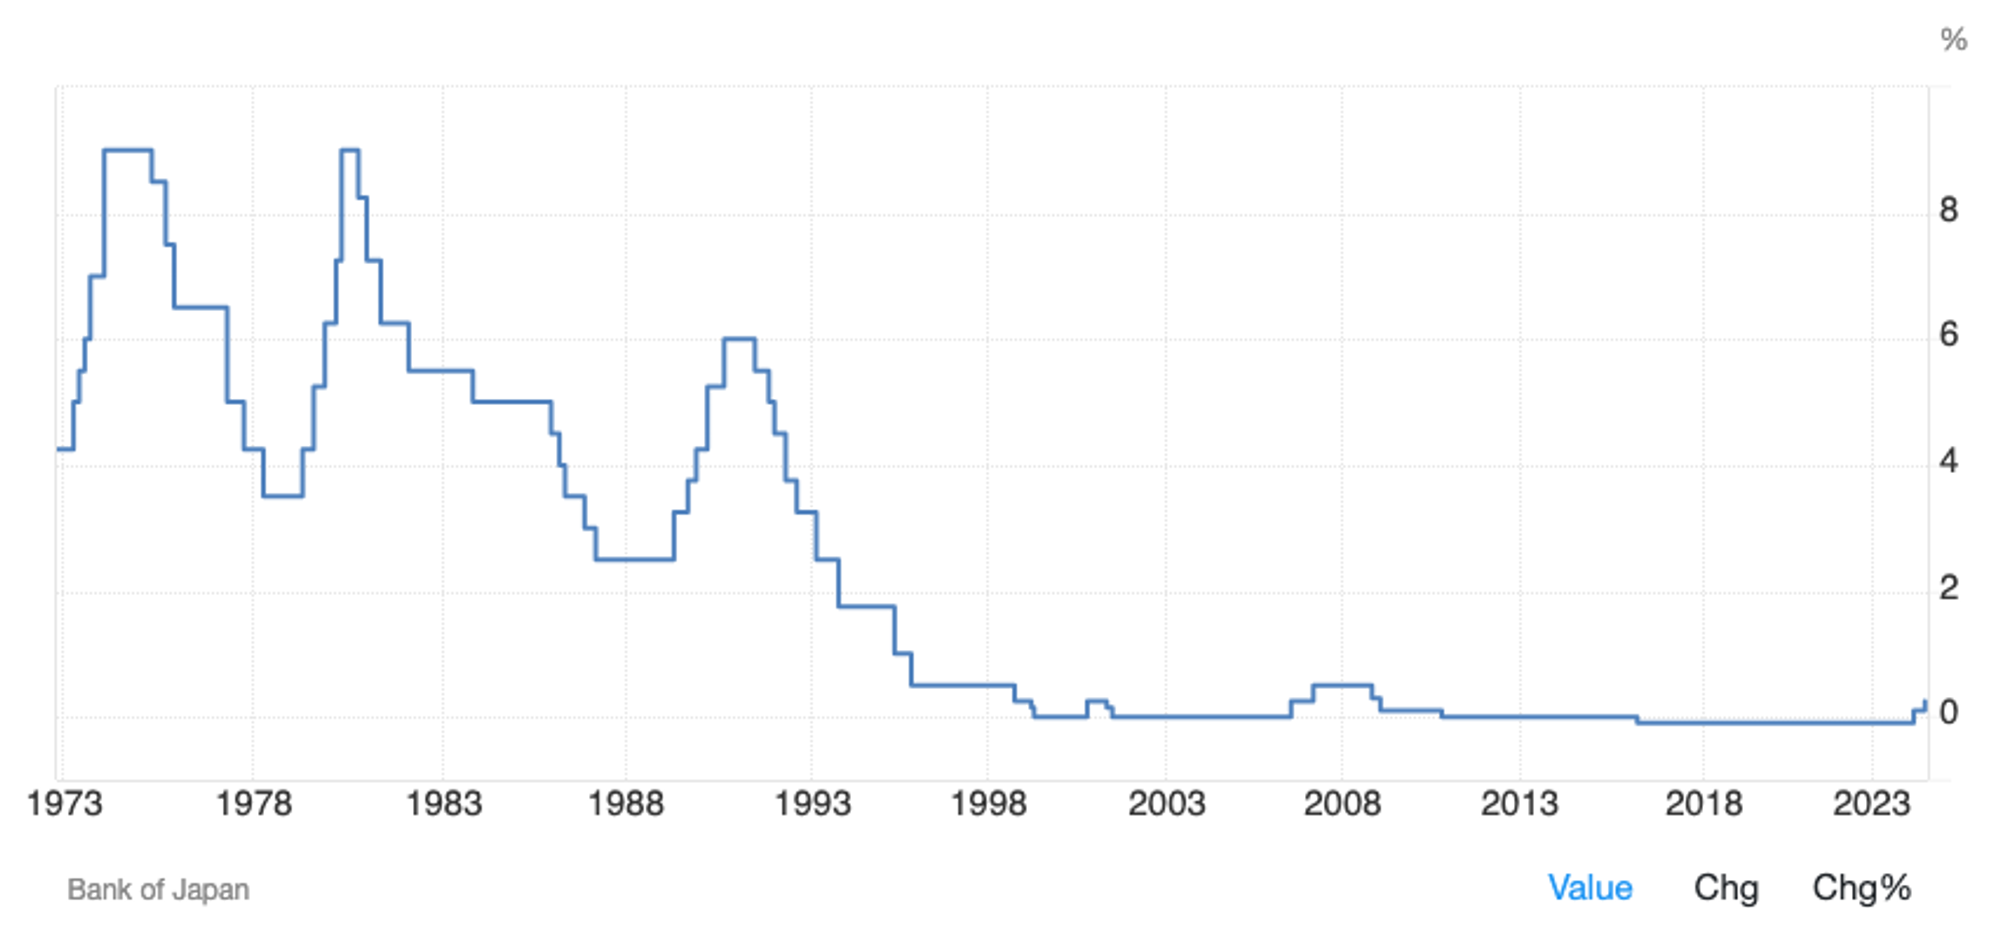
Bank of Japan (BoJ) maintained virtually zero or negative interest rates since the great financial crisis in 2008. The rates have been kept at -0,1% since 2016. In March 2024, BoJ increased the rates from -0,1 to +0,1%, still not a major surprise. A surprise came several months later on the 31st of July meeting when the bank decided to increase the rates from 0,1% to 0,25%. This became the most significant increase since the great financial crisis and sparked widespread panic among investors.
Due to the long-term virtually zero interest rates in Japan, investors borrowed JPY 157 trillion (approx. USD 1 trillion) in Japan, converted the loans into USD, and invested the funds into US securities (bonds and equities), cashing the interest rate differential between US and Japan. With the expectations of this interest rate differential disappearing, investors started closing this long-built-up position.
Japan’s Interest Rates:
Investors started to sell US securities, convert the USD back into JPY, and pay back their JPY-denominated loans. Since the carry trade profits depend highly on stable currency exchange rates, any adverse movement can negate interest rate gains. If many investors start to close their positions simultaneously, the USD/JPY depreciates significantly and increases the losses to investors that have yet to unwind their carry trade positions.
Since many traders use leverage to amplify returns, many faced margin calls and were forced to sell their US positions, to close their Japanese loans built up over the last 10 years.
Negative jobs market data
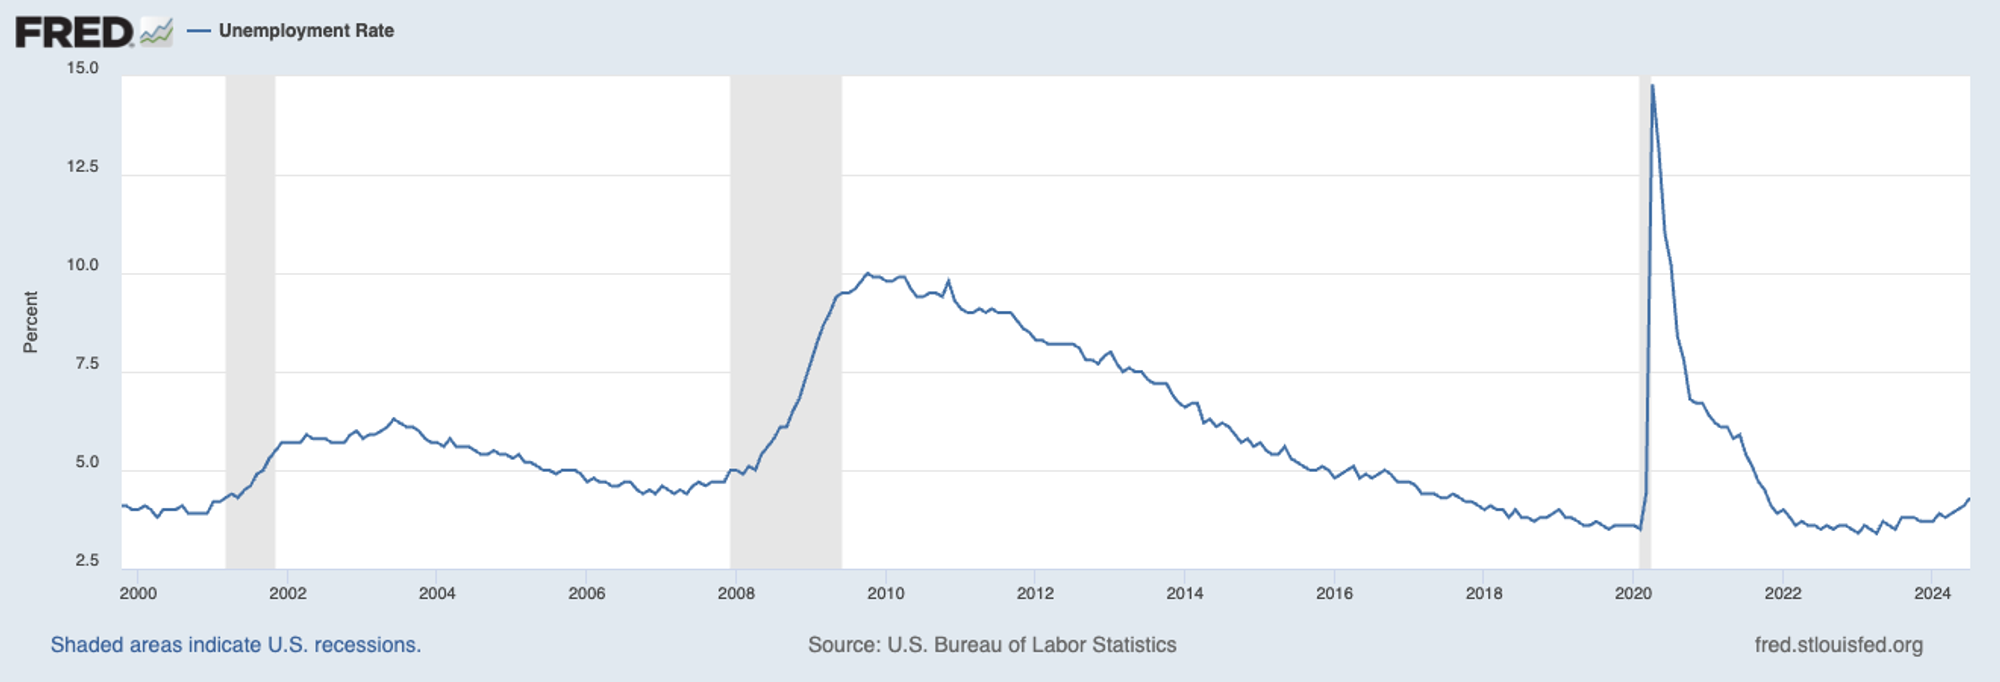
In July, the U.S. unemployment rate rose to 4,3% from 4,1% in June, jumping to near a three-year high. It is the fourth straight monthly increase. The number has recently risen from a five-decade low of 3,4% in April 2023 to the highest level since September 2021.
US Unemployment rate:
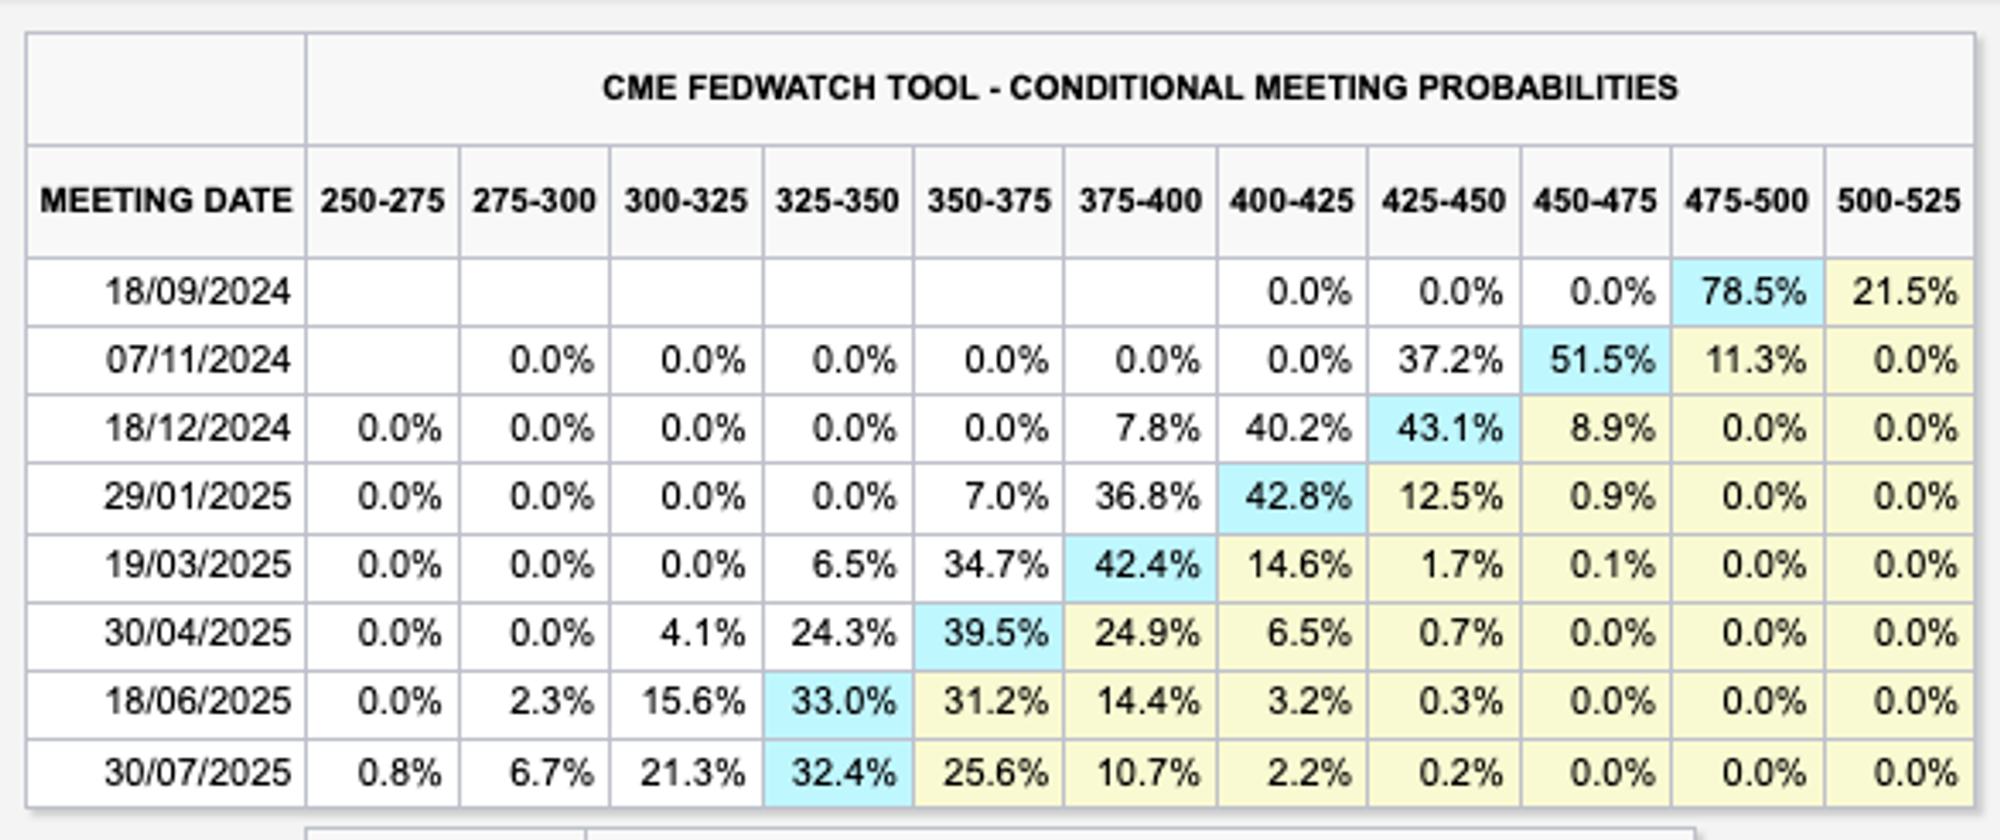
The negative unemployment numbers increased the probability of FED decreasing rates by 50 bps to 4,75 – 5,00% in September instead of only 25bps previously expected. The market now expects a range of 4,25 – 4,50% (a four 25 bps cut) at the end of the year, and 3,25 – 3,50% (eight 25 bps cut) in about a year’s time. The increased liquidity in the markets, caused by the 2% decrease in rates could become the catalyst for both equities and digital asset markets.
Probability of rates change:
Disappointing earnings reports
Second, major tech companies such as Tesla, Alphabet, Intel, Amazon, and Microsoft announced disappointing earnings reports. Intel reported a $1,61 billion net loss for the quarter and announced layoffs affecting approximately 15k employees. This led to a 27% drop in the stock price. Tesla’s price dropped more than 11% after reporting earnings that fell short of analyst expectations. Last but not least, Microsoft faces challenges in convincing investors that its significant investments in AI will pay off.
These disappointing earnings reports in major companies spark fears of a recession hitting the economy. Despite the recent earnings surprises, several banks, such as Julius Bär remain convinced about the strong fundamentals of the S&P500 companies.
Middle East tensions
Over the same weekend (3-4th of August), the assassination of Hamas political leader Ismail Haniyeh in Tehran and a Hezbollah commander in Beirut has led to heightened tensions. Iran’s Supreme Leader Ayatollah Ali Khamenei has vowed retaliation, increasing the risk of broader regional conflict.
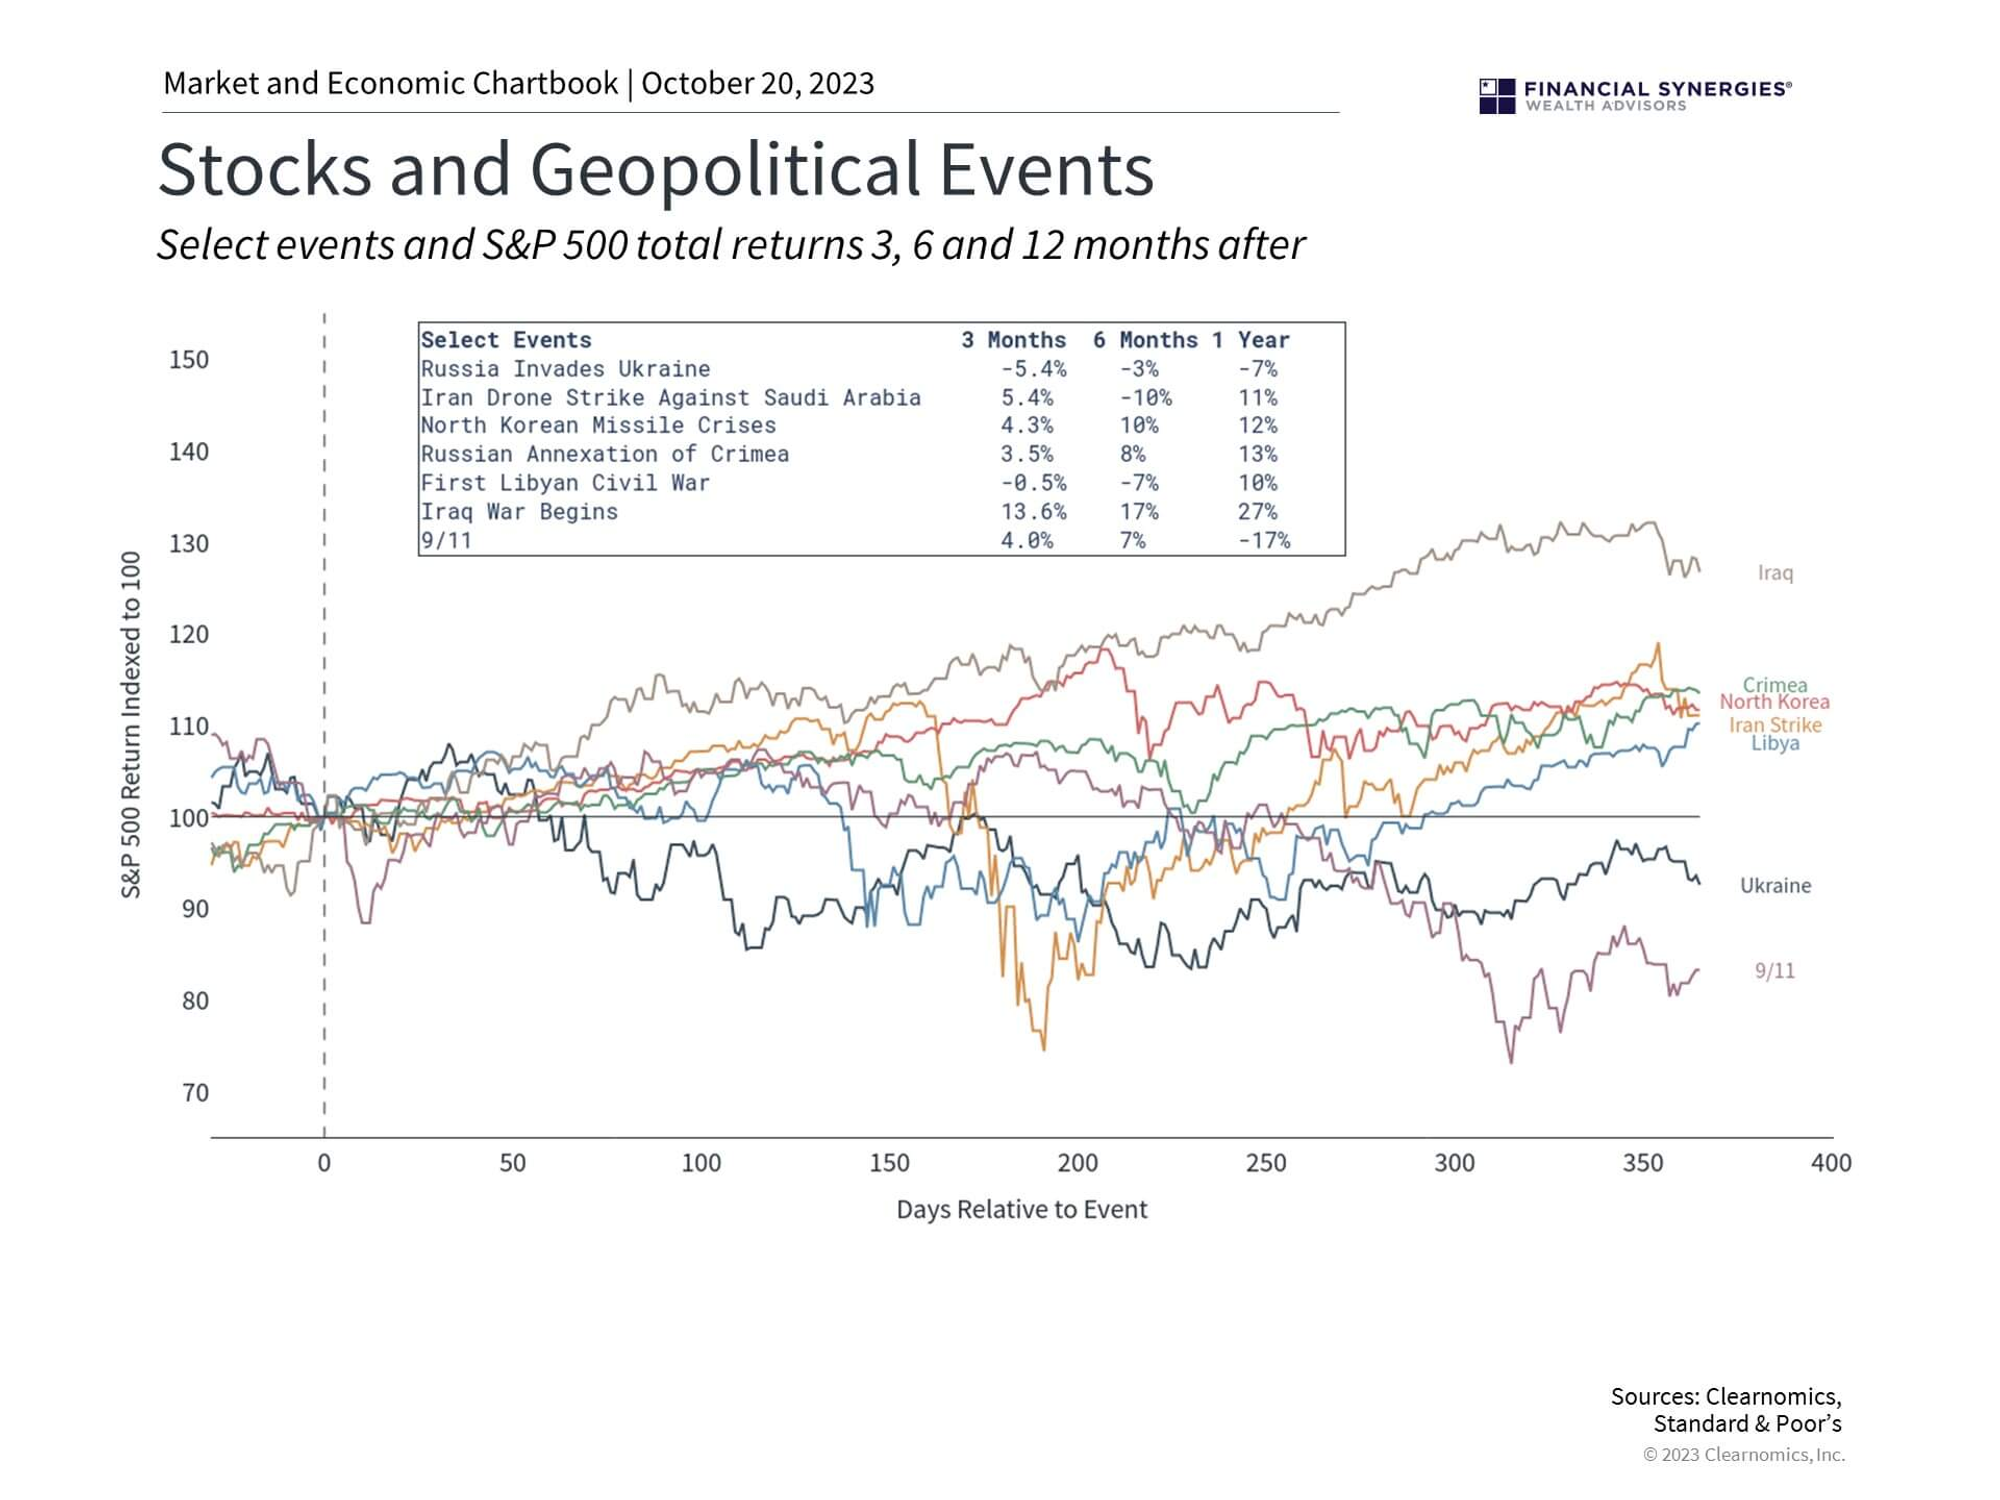
The impact geopolitical tensions in the Middle Easton on the markets varies depending on the economic cycle. Historical data shows mixed responses, with markets often declining short-term but recovering long-term.
Crypto specific reasons
Uncertainties about the US elections
Initially, it wasn’t clear whether Donald Trump would crystallise as a pro-crypto presidential candidate. Trump positioned himself as a pro-crypto candidate in early July. He affirmed his position by attending the Bitcoin 2024 conference in Nashville end of July. Thanks to his political shift the crypto market became correlated with Trump’s odds of election success. For example, when Trump survived the assassination attempt, his odds of winning the election skyrocketed from 60% to 70% within two days. This influenced Bitcoin which traded 10% higher.
Institutional sell pressure
Jump unwinding positions
Over the past 10 days, Jump Crypto has moved $277 million worth of ETH to exchanges amid an escalating selloff in the crypto markets. The rumor was that Jump Trading, facing margin calls in traditional markets, required liquidity over the weekend. The exact reason why Jump Crypto was selling is still unclear.
Mt. Gox distribution
Following the demise of Mt. Gox in 2014, in summer 2024 its creditors finally started receiving distributions. In fact, creditors received around $6B in BTC in July and are still waiting for another $3B. Investors feared that many of the receiving investors would sell this distribution negatively influencing the Bitcoin prices.
Altcoins unlock schedules
Many high digital asset tokens that launched over the past 12 months started facing unlocking schedules. Just for illustration, at least $347M worth of new tokens were unlocked over a one-week period. This is a significant sell pressure on altcoins that would potentially need to be absorbed if the investors decide to sell the tokens.
Forced liquidations
Monday’s crash in the crypto market led to $1B in liquidations as seen in the chart below. Bitcoin futures were hit particularly hard, with $464M liquidated, and ETH futures saw losses of $382M. More than 275K traders experienced liquidations, including the largest single order, a BTC/USD trade valued at $27 million, which took place on the Huobi exchange.
Total Liquidations:
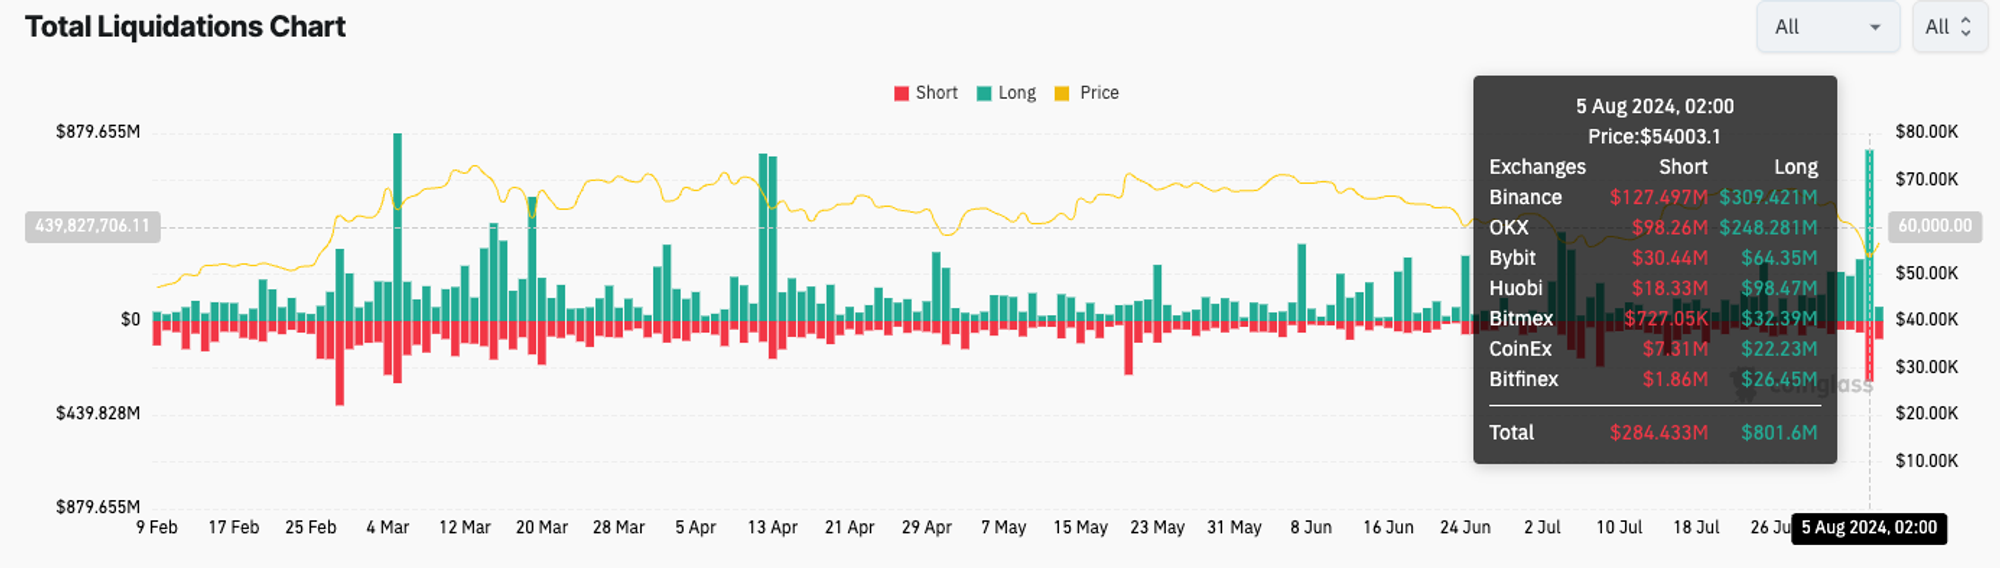
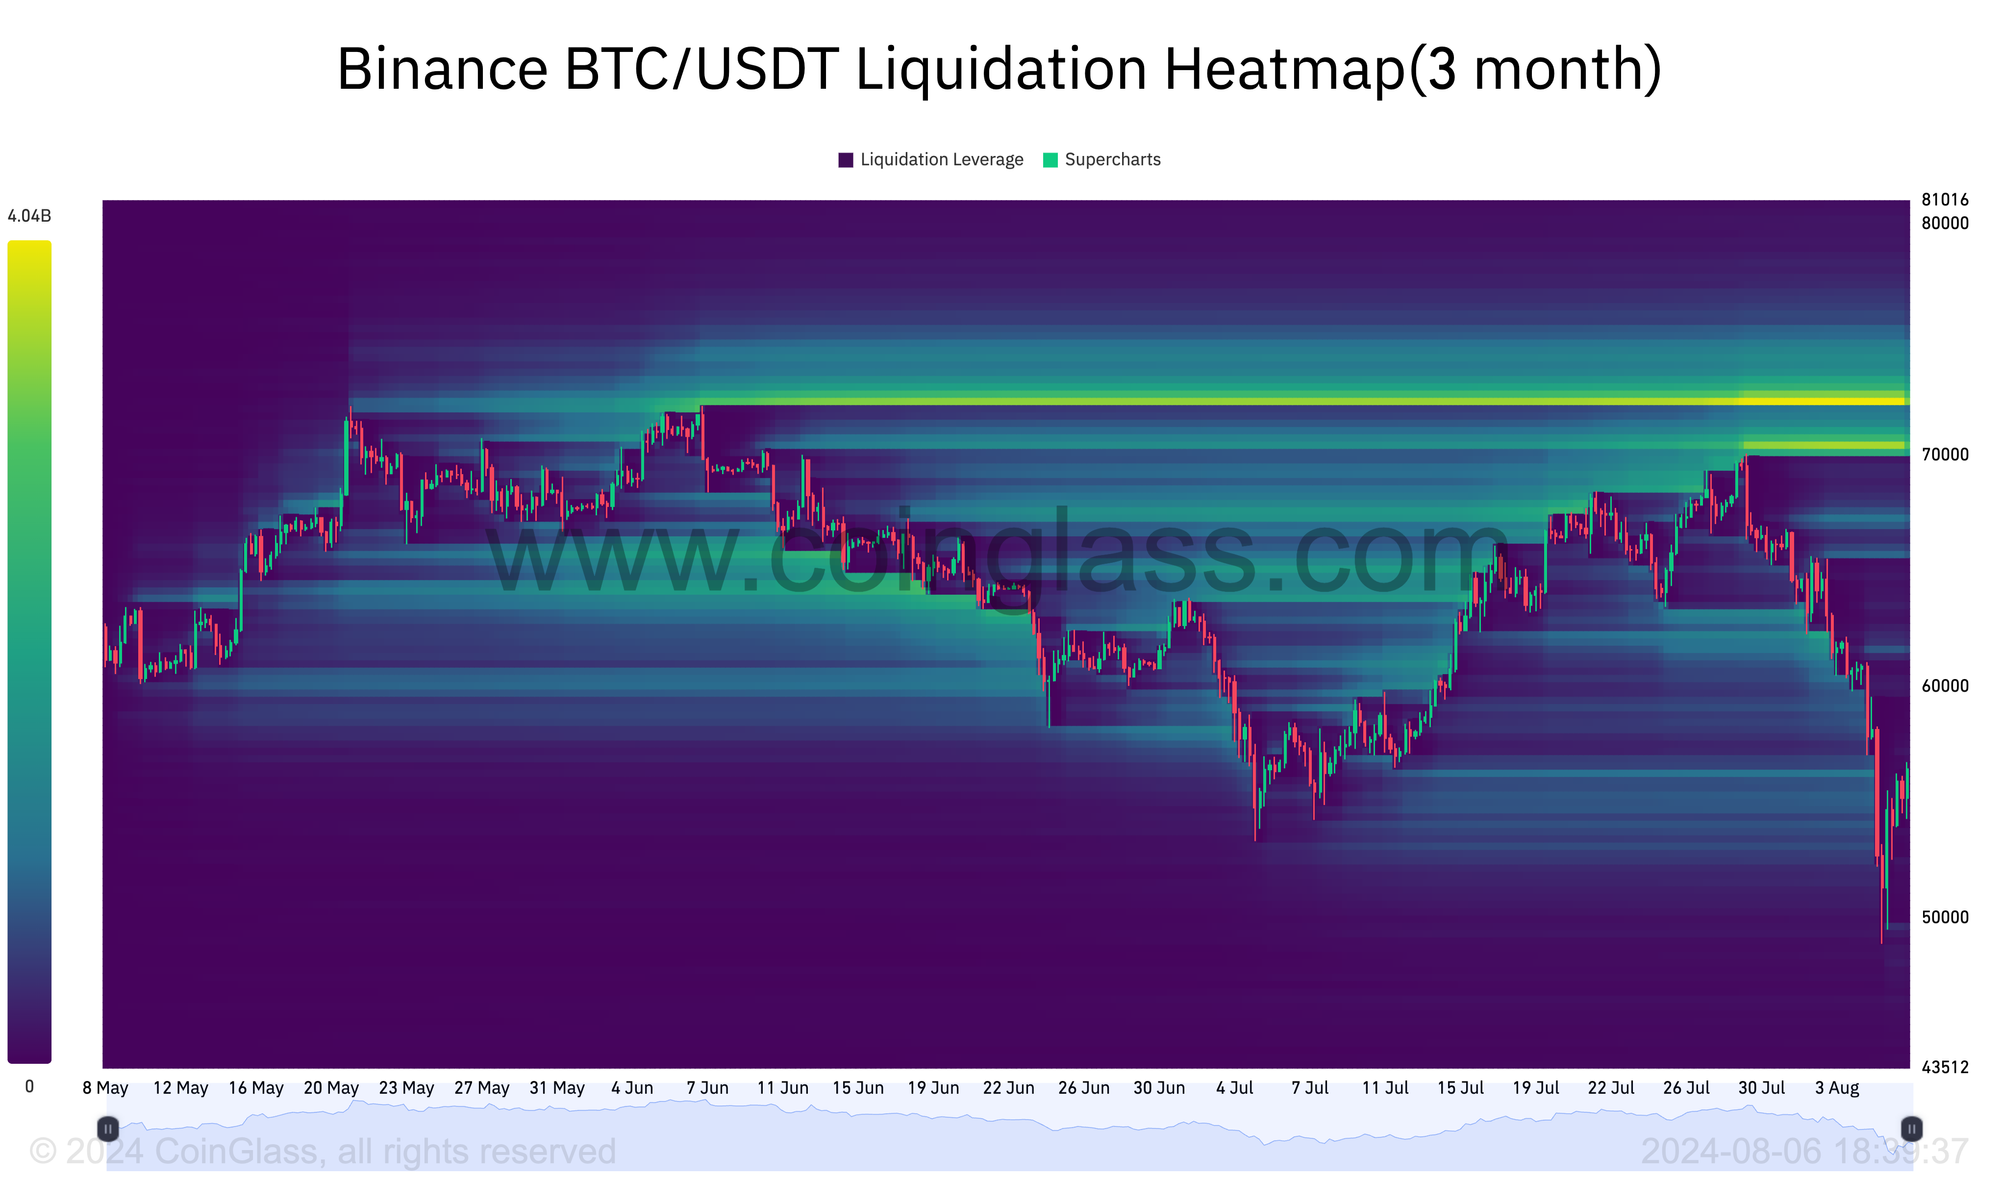
The total open interest on all assets tracked by Coinglass decreased by 31% from $67,95B on July 30th to $46,66B on August 6th. The market was over-leveraged and was not expecting such a fast sell-off. Traders were unable to increase their collateral and were getting liquidated fast. This exaggerated the market move even more. Looking at the current liquidation heatmap, as of August 6th, there are no liquidation thresholds below the current bitcoin prices ($55k).
Liquidations Heatmap:
Source: Coinglass
ETF flows
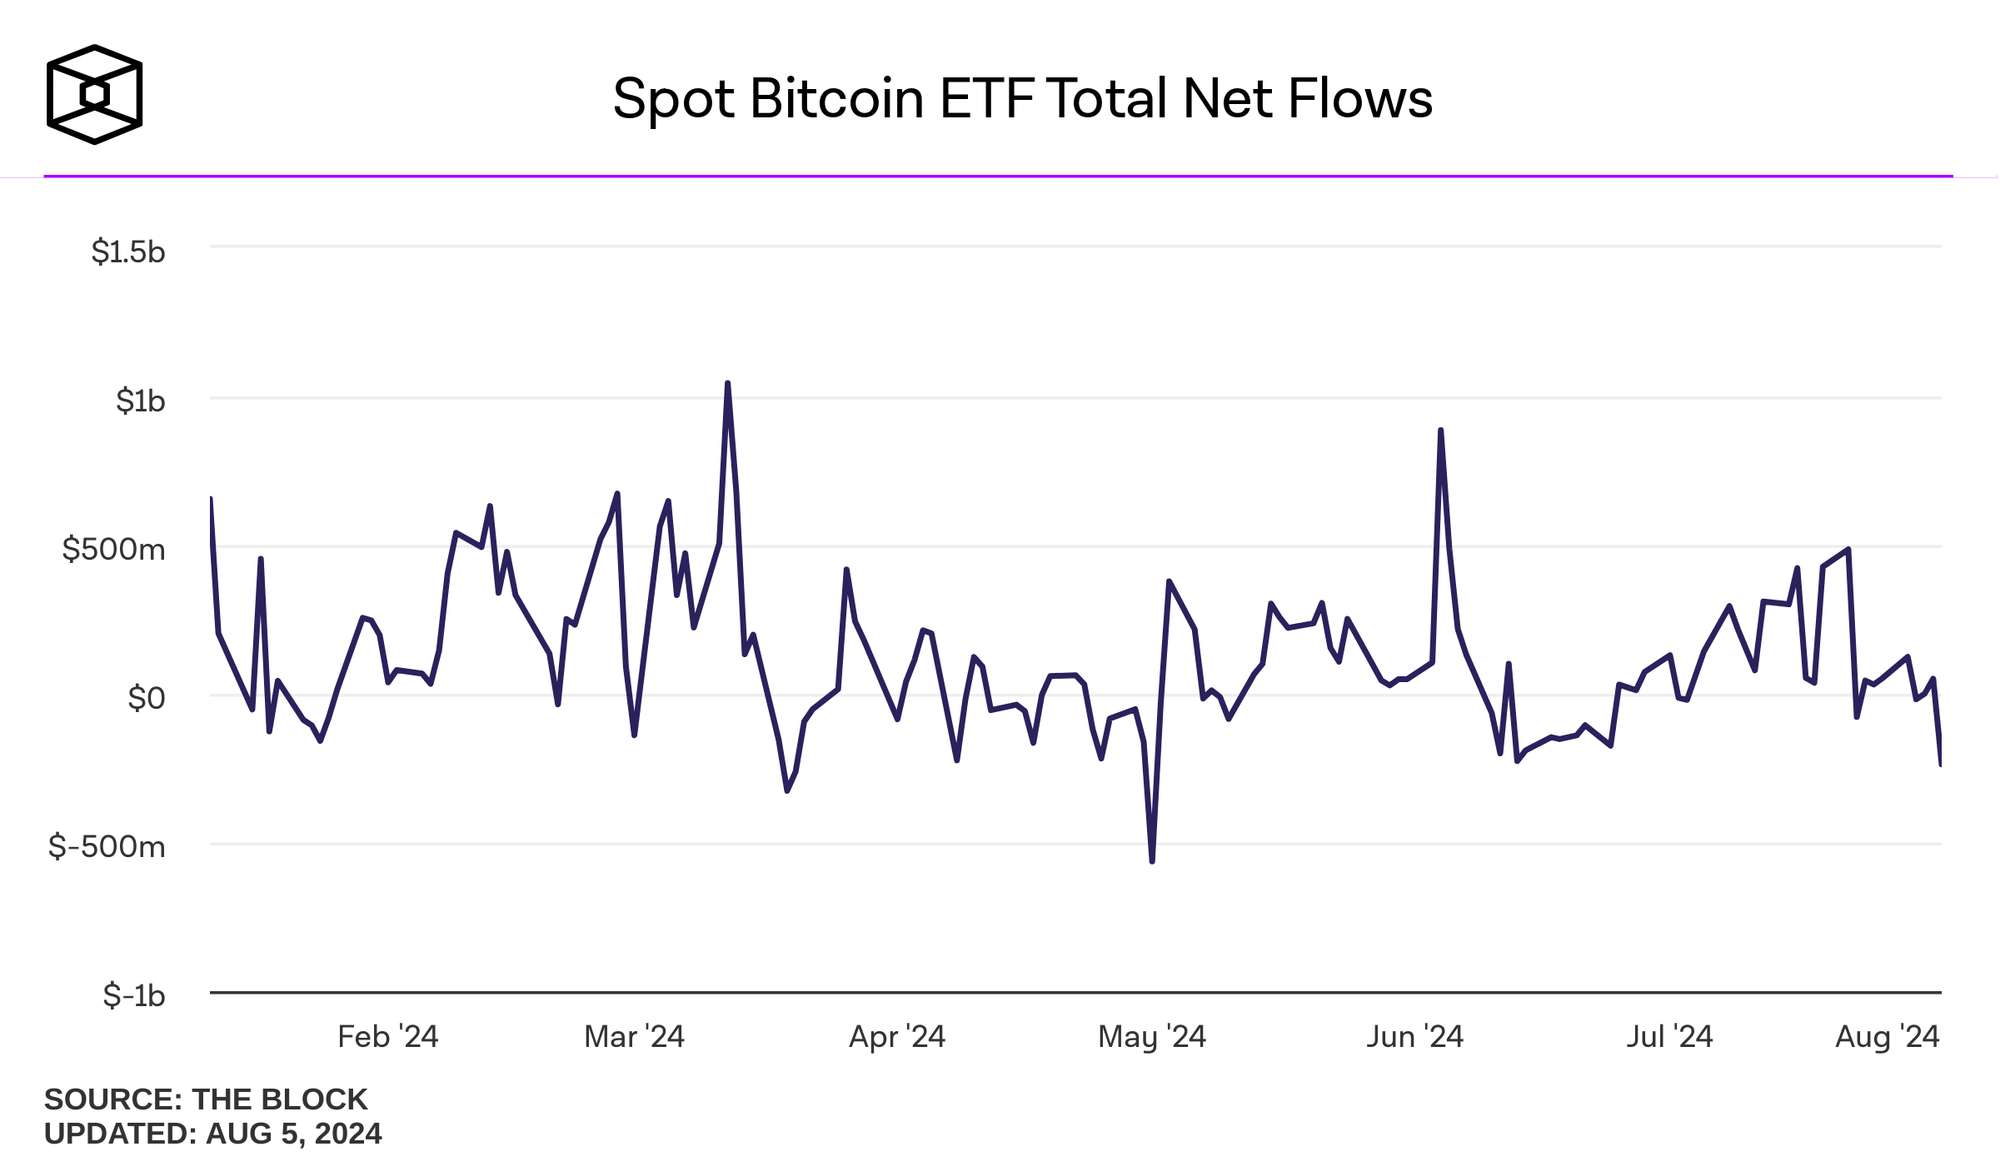
Traditional finance vehicles (mostly Grayscale Bitcoin trust) held 621k BTC just before the ETFs launched in January 2024. Today, all traditional finance vehicles (ETFs + ETPs) hold around 918k of BTC equating to $51B. This is a gain of 48% in BTC terms and around $16,6B new inflow at the $57k/BTC prices. ETF inflow was the major driver of Bitcoin’s 67% growth in February and March since 70% of all the cash inflows ($11,6B) happened in those two months.
Spot Bitcoin ETF Flows:
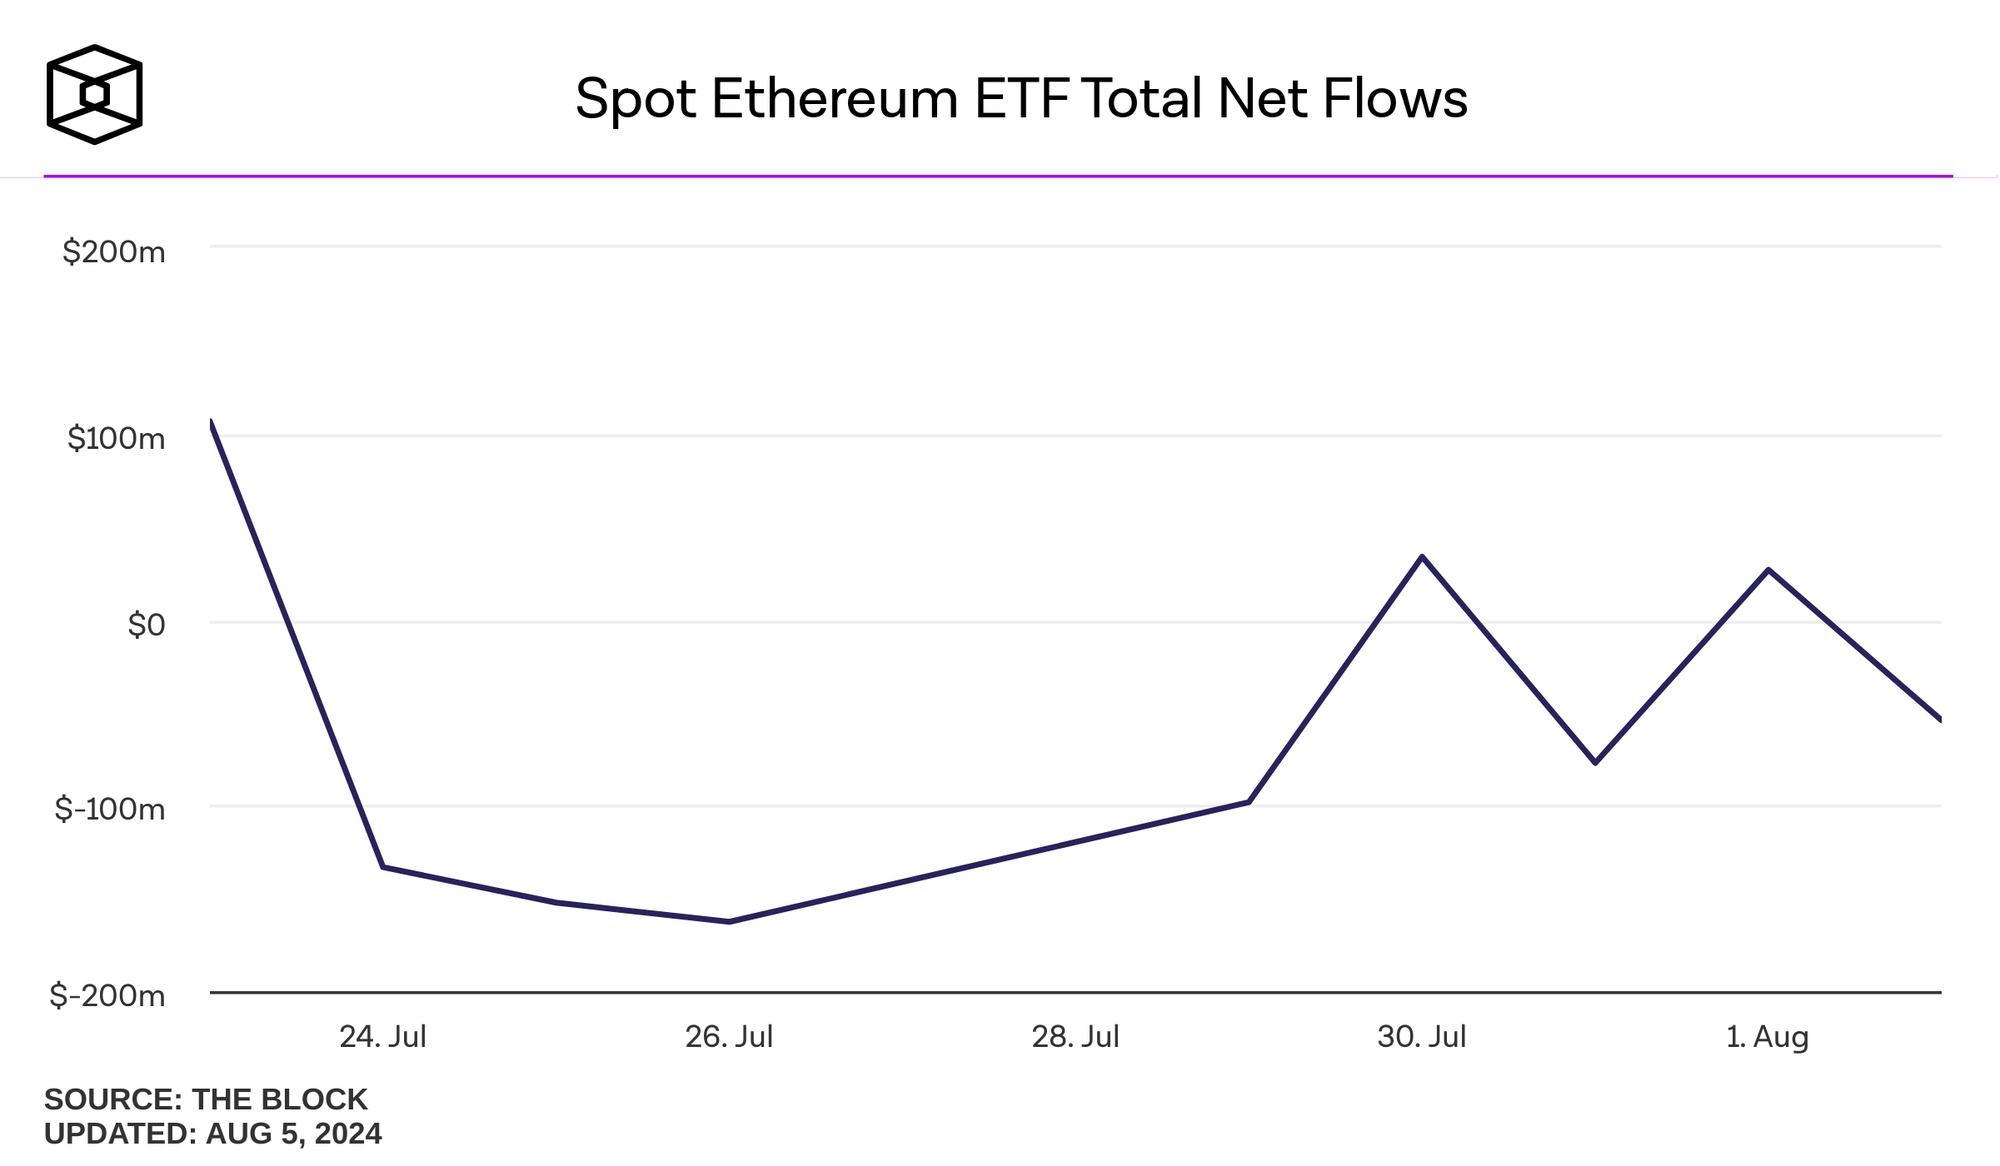
While investors didn’t expect a nominally similar inflow into Ethereum ETF, they expected at least some material positive inflows. Instead, from the 23rd of July to the 2nd of August, we have seen a net negative outflow of 110K ETH (~$277M at $2500/ETH) from all the traditional exchange-traded products. Negative flows added to the recent negative sentiment around Ethereum. However, we need to take into consideration the fact that BTC ETF inflows started to ramp up only around 2 – 3 weeks after the actual launch of the ETF.
Spot Ethereum ETF Flows:
Mid to long term implications
The fundamentals of the digital asset market remain stable, with no events indicating any issues in the current traction or the technology. We believe this sell-off was exaggerated due to the changing macro and geopolitical environment, and was amplified by forced liquidations due to the unwinding of the JPY/USD carry trade. We believe these to be short-term pressures and expect them to subside, leading to a market rebound in the coming months. As long as there are no surprises, the actual decrease in interest rates should start acting as a catalyst for positive price movements in the crypto markets.
Bitcoin
There are many factors in play influencing the Bitcoin price both on the demand side (ETF inflows, US election outcome, emerging markets demand) and the supply side (halving, miner hashrate, dormant coins). We believe the Bitcoin price will be driven by macroeconomic situation (ie injections of liquidity by the FED, US Treasury and will be correlated with the increase of USD M2) and by the growth of the user demand. With regards to the user demand, Bitcoin network processed 19M transactions in the month of July, which is at its all time high.
Ethereum
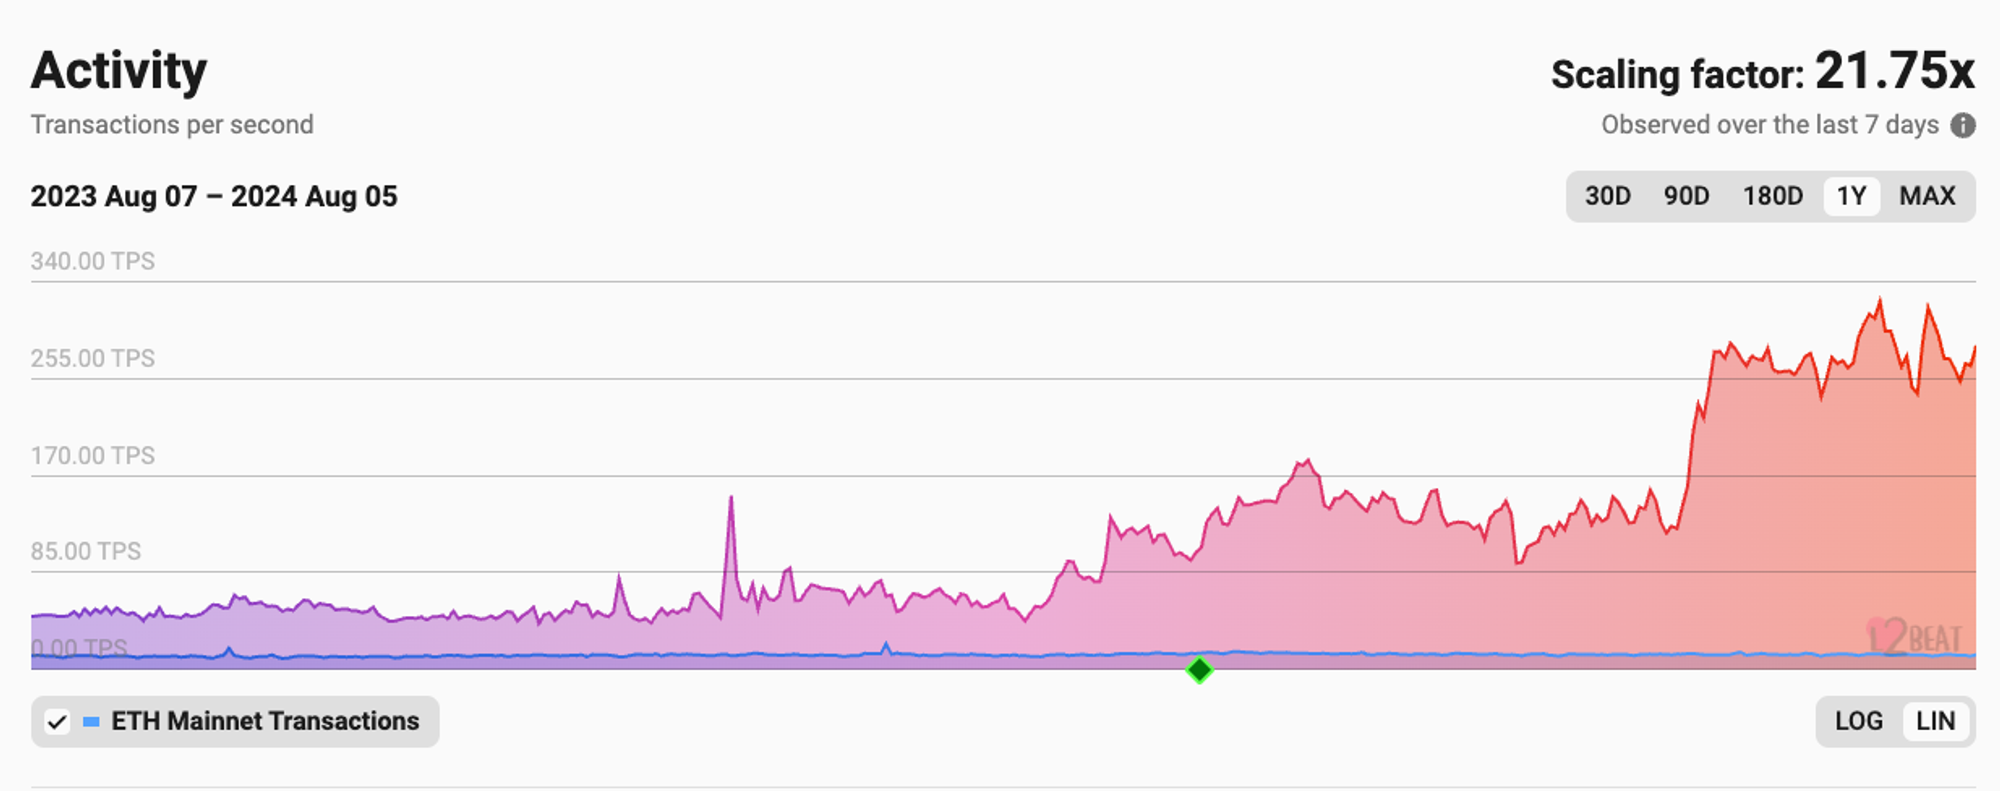
ETH ETF is yet to experience large capital inflows. It took Bitcoin several weeks to start seeing significant inflows from ETFs. Something similar could happen with ETH ETF. From the tech perspective, Ethereum is on track executing its “rollup-centric” roadmap. The demand of transactions in Ethereum ecosystems in terms of transactions per second “TPS” of all layer 2 “L2 rollups” settling on Ethereum increased 3,9x from 73 TPS in January to 283 TPS in August.
Solana
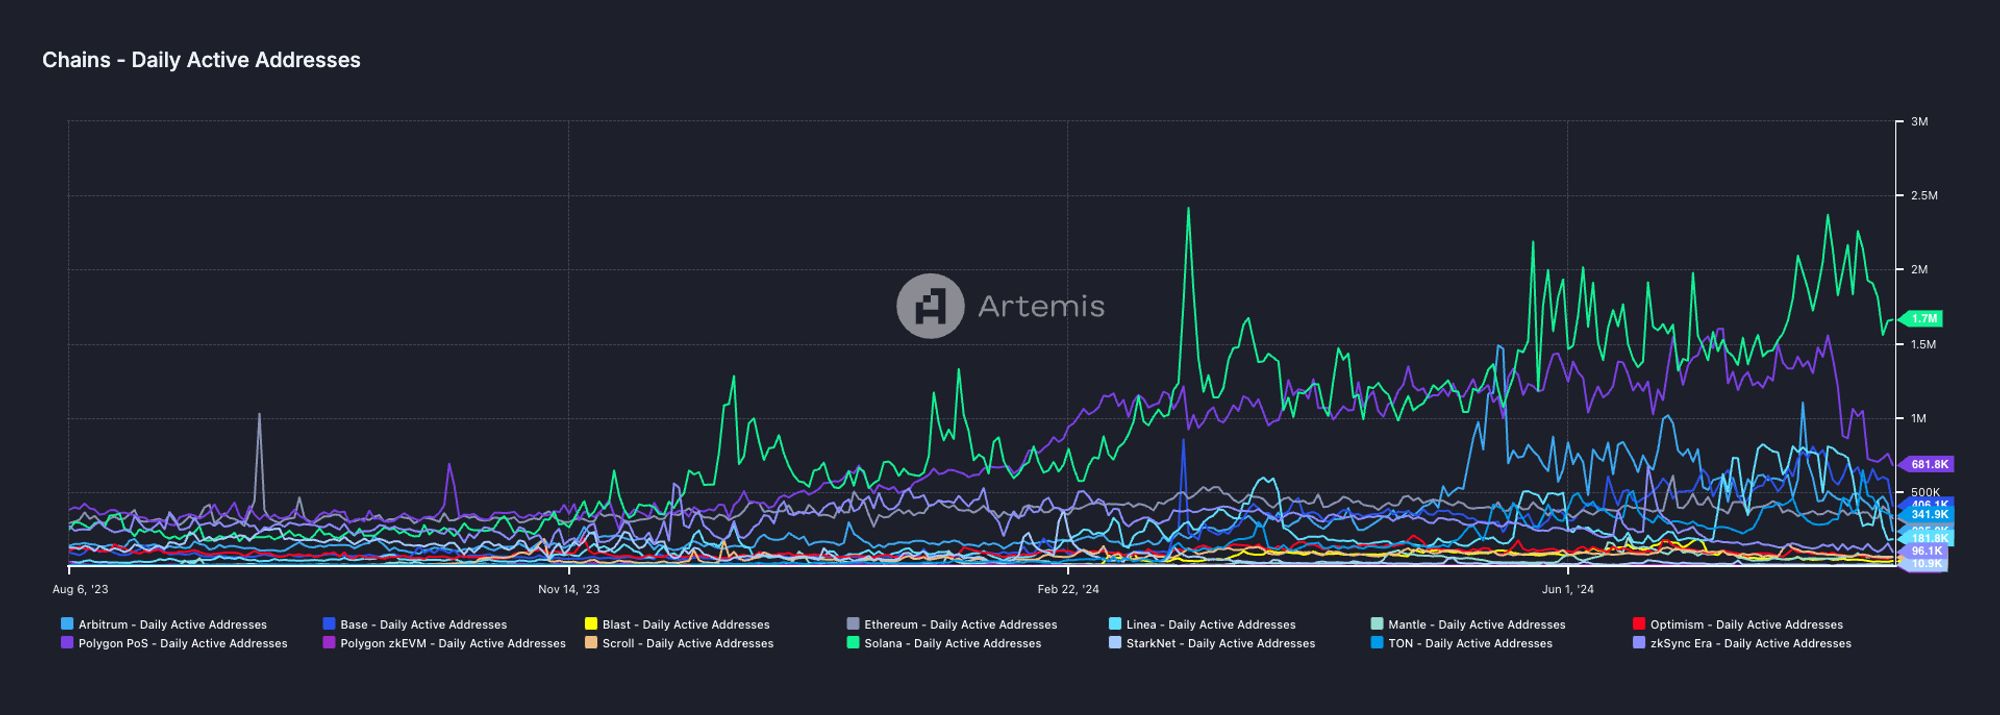
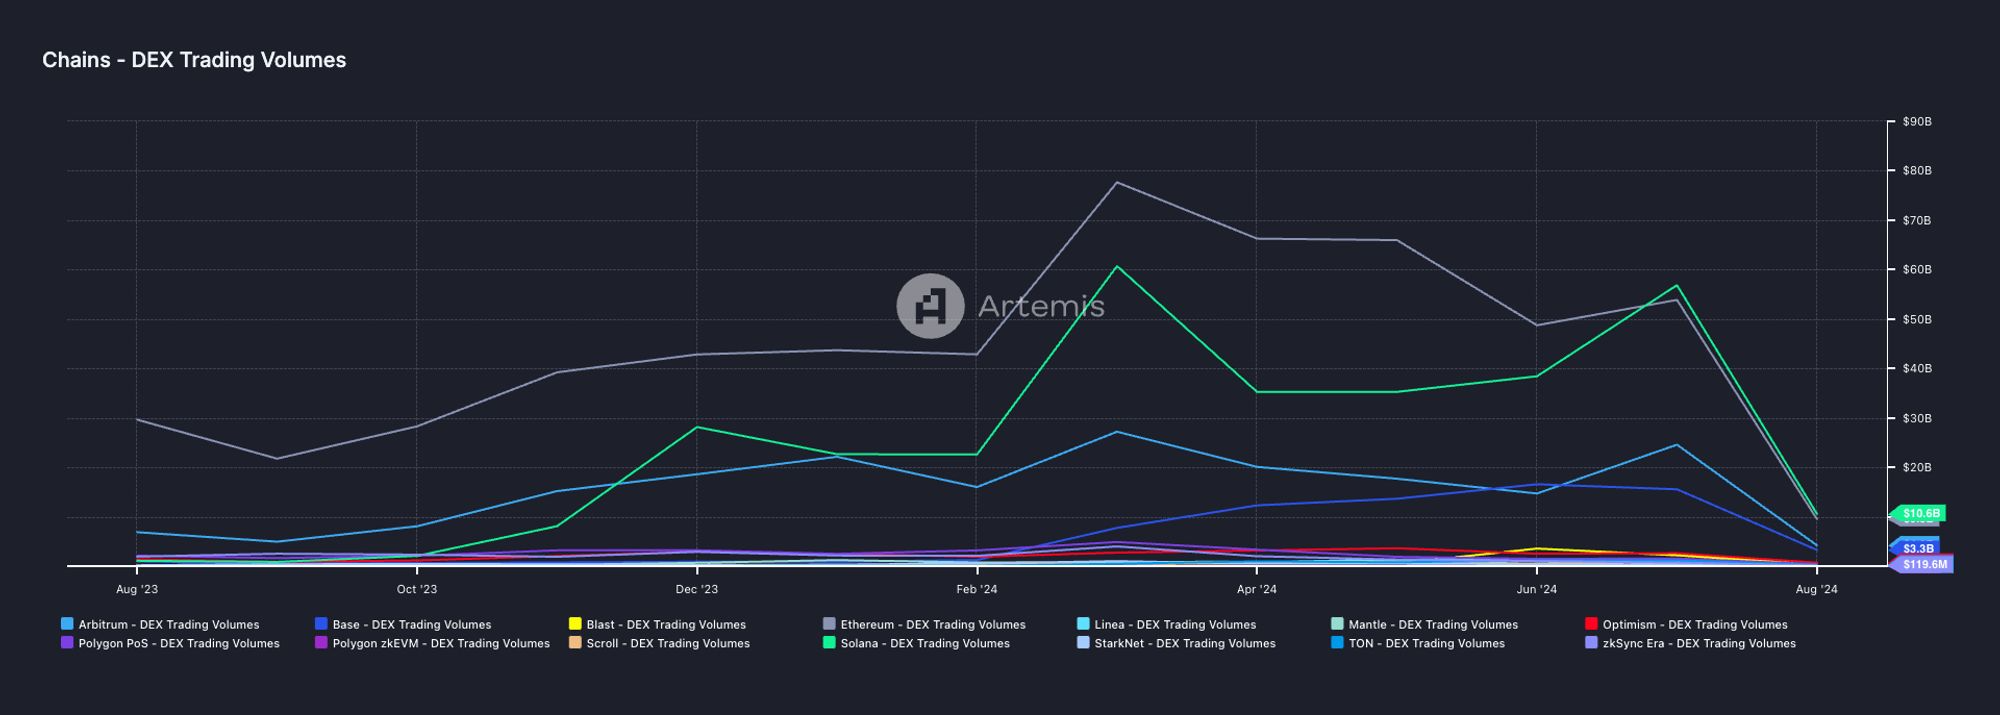
Solana traction metrics are beating all time highs. Solana has the highest number of daily active addresses and, for the first time in July, it outperformed Ethereum in terms of monthly decentralized exchanges trading volume.
Daily Active Addresses:
Decentralized Exchanges Traded Volume:
Despite relatively small fees per transaction, Solana monthly revenues made it to the 3rd spot ($52M) behind Tron ($154M) and Ethereum ($101M), while overtaking Bitcoin ($21M). The chart below shows the 30-day revenue of the major blockchains tracked by Tokenterminal.
We think the drop in prices in August 5th was a one-off, driven by over-leveraged traders on both tradfi and crypto markets. We expect BTC, ETH and SOL to perform well going forward, driven by the macroeconomic outlook and growth in their fundamentals.
RockawayX, one of the largest groups in Europe focusing on blockchain technology and digital assets, in cooperation with AMISTA, an investment company that is part of the J&T Group, established a second open-end fund that makes it possible for an even larger circle of investors to invest into the world of financial services of the future: